Using this type of analysis, customers that have a similar profile are more likely to be grouped together, and subsequently, different market strategies are possible to target their individual preferences:
- Differentiated marketing actions for personalized engagement
- Promotions, discounts or commercial activities
- Loyalty actions based on different touch-point behavior
Method
To identify segmented behavior and draw conclusions we will use two Machine-Learning (ML) concepts:
- Hierarchical clustering
- Principle Component Analysis (PCA)
Algorithms referred here are a subset of a general algorithm class known as unsupervised learning. Those types of algorithms are used when we don’t have a target variable (something specific to learn), but want to find hidden rules or behavior in data without knowing in advance what we expect to find.
Dataset
For this analysis we use 2016 retail pharmacy loyalty dataset that was fully anonymized and sampled for ca 17 000 individual users. Generally the dataset consists of 17 categories in relation to internal pharmaceutical categories:
- Packing_materials
- Anatomical_footware
- Supplements
- Galen_remedies
- Natural_remedies
- Food
- Cosmetic_products
- Medicine_BRX
- Magistral_preparations
- etc.
Key concepts for analysis would come down to next components:
1 .Identify spending pattern of every user
2. Find homogenous clusters / user combinations that show similar behavior
3, Detect how does that behavior differentiate across the average user behavior
4. Design relevant products/offers to personalize user experience
Spending Indentification
Bellow we can see a general histogram of spending patterns for selected users related to their pattern of purchasing (log transformed but not z-transformed) in relationship to selected categories:
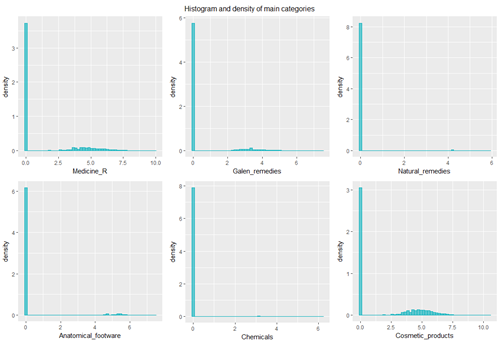
All non-available purchase has been reduced at log value of 0.
To check for client behavior patterns, we can directly check their correlation between each self:

-that-is-scaled-to-0-2-range.png.aspx?lang=en-US&width=500&height=362) Example of similar spending users:
Example of similar spending users:
> User 13 vs ID 22
Packing_materials Anatomical_footware Supplements Galen_remedies Natural_remedies Food Food_for_special_medical_purposes Chemicals
13 0.000000 0 7.323890 0 0 0 0 0
22 -1.609437 0 5.530262 0 0 0 0 0
- Similarity is primarily coming from buying a lot of supplement products
Example of dissimilar users:
> User ID 3 vs ID 18
Packing_materials Anatomical_footware Supplements Galen_remedies Natural_remedies Food Food_for_special_medical_purposes Chemicals
3 0 0 5.473363 0 0 0 0 0
18 0 0 0.000000 0 0 0 0 0
- Diss-similarity is primarily coming from not-buying a lot of supplement products for user 18 vs user 3
This way we can immediately know which customers have a similar purchasing habit and in what extent. Any campaign, targeting a specific set of customers, can analyze what people to target based on their similarity and if you find a specific user you can cross check all other users in your database to find the most similar ones.
This is generally useful in f.e. additional high value targeting of high spenders after we identify the key cluster we want to target. We can cross reference and identify key users that are similar to each other in a huge extent and offer them additional the same personalized service.
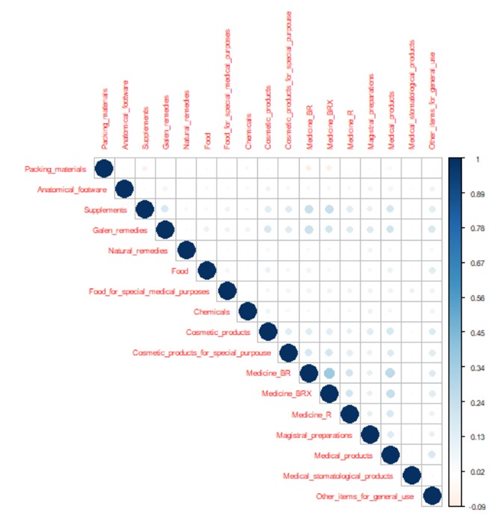
Also we can check for correlation in purchasing habits between different categories.
We do note that in this instance the correlation is mostly positive, but the severity is not very big. In a sense purchasing patterns are mostly independent across selected categories. By this notion, we should not expect PCA decomposition to identify a large amount of variance explained by first few components.
Identifying key principal components
To analyze variability of the data we will use PCA - Principle Component Analysis. The goal for us is to find out how much linear variability does the data exhibit. Since there is a decent amount of correlation in purchasing habits between customers there is a high chance that on lower dimensions the purchasing patterns can be reduced on only few main components.
Note: we do scale the data by their average spending and standard deviation to reduce influence of individual category variance
PCA decomposition on categories:
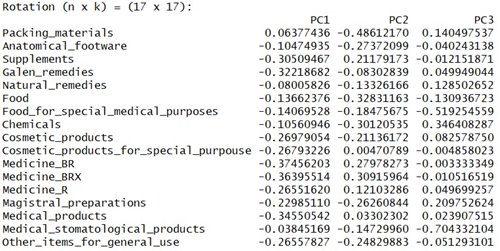
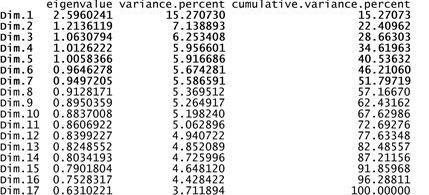
Conclusion: around 50% of variance is explained by first 7 factors
Variance explained:
Plot of individual customers in the first 2 dimensions:
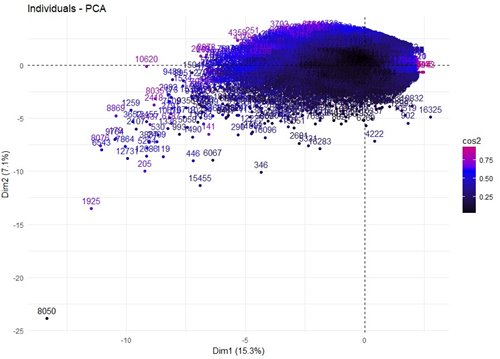
Plot of individual categories in relationship to the first 2 dimensions:
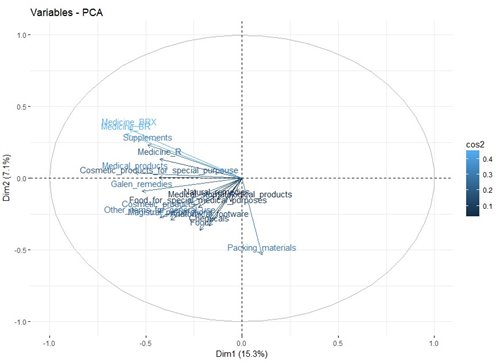
Primarily medicine and supplements are highly explained by first 2 dimensions.
We can check the correlation of quality of representation of the individual variables to different dimensions to confirm the above picture:
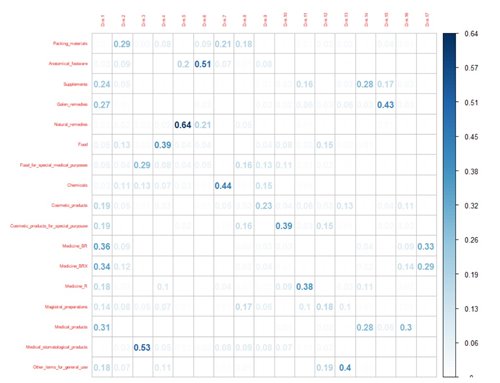
Interestingly the natural remedies are in the specific section of their own and are located on the 5-th dimension explaining around 6% of variance. Similar conclusions can be made by other comparisons across different dimensions.
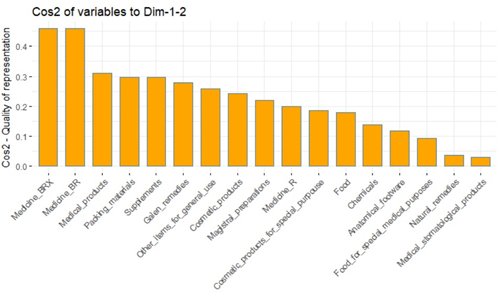
To see the main category contribution for first two dimension we can check the % of the contributions in defining the newly constructed dimensions:
We do expect this to be in line with the above - mentioned quality of representation analysis
Note: reference line corresponds to the expected value if the contribution where uniform.
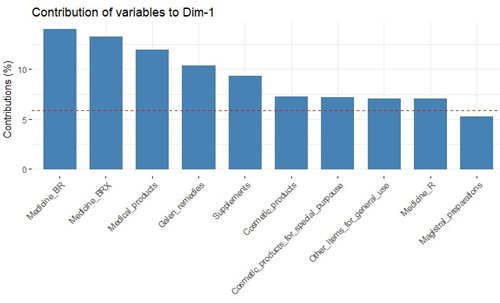
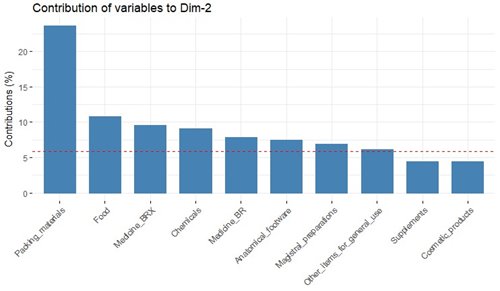
We then construct hierarchical top-down clustering on the newly detected PCA dimensions.
Since the variance explanation does rise steadily and the correlations, in spending across categories, were marginal, we decide to use all available principle components within the clustering procedure.
Resulting hierarchical cluster:
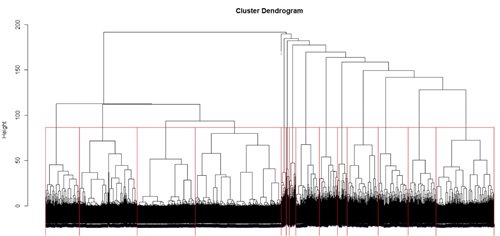
Cluster has been segmented into 15 distinct clusters related to chosen business rule. It gives us the ability to segment users more granularly by their purchasing habits, but at the same time it isn’t too high segmentation for us to have (f.e. 30 clusters).
Mean yearly user spending across all categories:
.jpg.aspx?width=500&height=209) Identified clusters
Identified clusters plotted in first 2 PCA dimensions:
.jpg.aspx?width=500&height=363)
Note that those clusters overlap when projected into the 2D space in regards to the variance explained. Variance is not fully explained only by the first 2 components.
If we f.e. segment the users on the following dimensions looking at only 2 clusters then the resulting components create the following graph with a lot more separability:
.jpg.aspx?width=500&height=364)
What does this mean from the BU point of view?
We can check the respectable cluster spending habits to detect different preference for users:
F.E. cluster 14:
Can be classified as very high supplements, very high cosmetic products preference
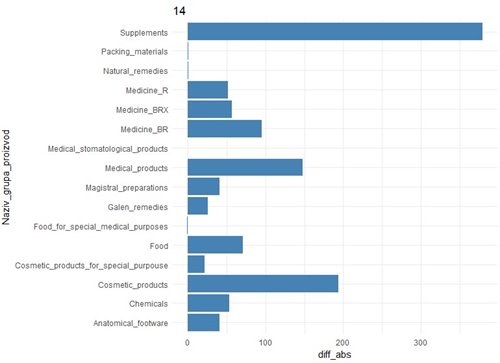
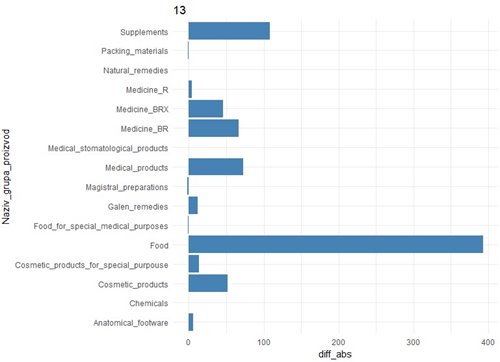
F.E. cluster 13:
Very high food consumption preference
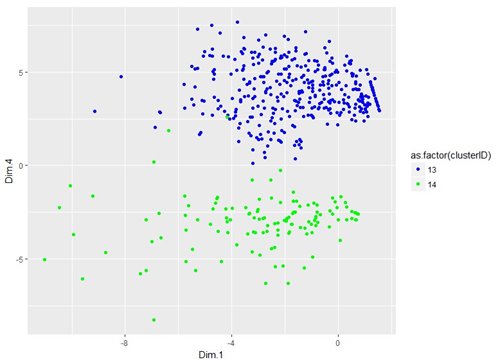
Plotting cluster 13 vs 14 on PCA components:
We should note we take the 1-st and 4-th PCA component to show that the model has excellent performance of data separation across two clusters when projected on relevant axes (Dim.4 is related to food category)
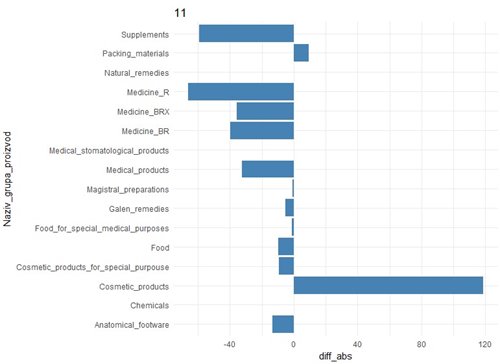
Other cluster examples:
F.E. cluster 13:
- very high food consumption preference
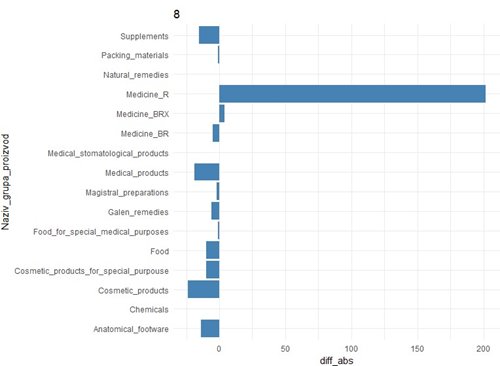
To summarize, hierarchical clustering has found:
Different clusters related to
different user preferences for buying product - bellow or above average. This also translates in total spending as seen bellow:
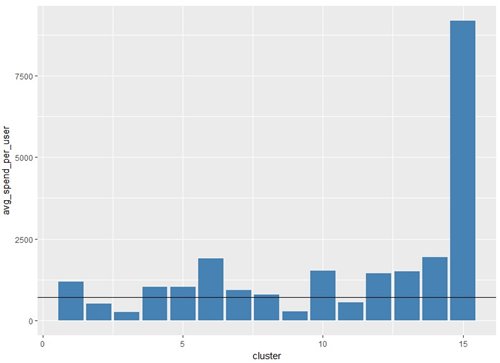
Business strategies that revolve around different cluster can now be applied with enhanced personalization service. This service can be marketed in a way to broadly target categories people spend a larger amount of money, and disregard options in categories individual customer has no preference of buying.
Different cluster sizes can help firms decide how to tailor their approach:
- should they use smaller number of clusters to have a broad, simple segmentation that can help individual firms identify key segments to concentrate on, or find low spending customers that can be targeted for feedback analysis (analysis of why customers spend lower than average monetary amount in specific categories)
- or should they use large number of customer segmentation clusters to find high value customers and their specific profile to tailor their approach even more specifically. F.e. this is very beneficial when identifying high spending users and their preferences as it would create a solution for better up-sell or cross-sell potential)